


Direct Proportion Symbol in Graphs vs Inverse Proportion Graphs
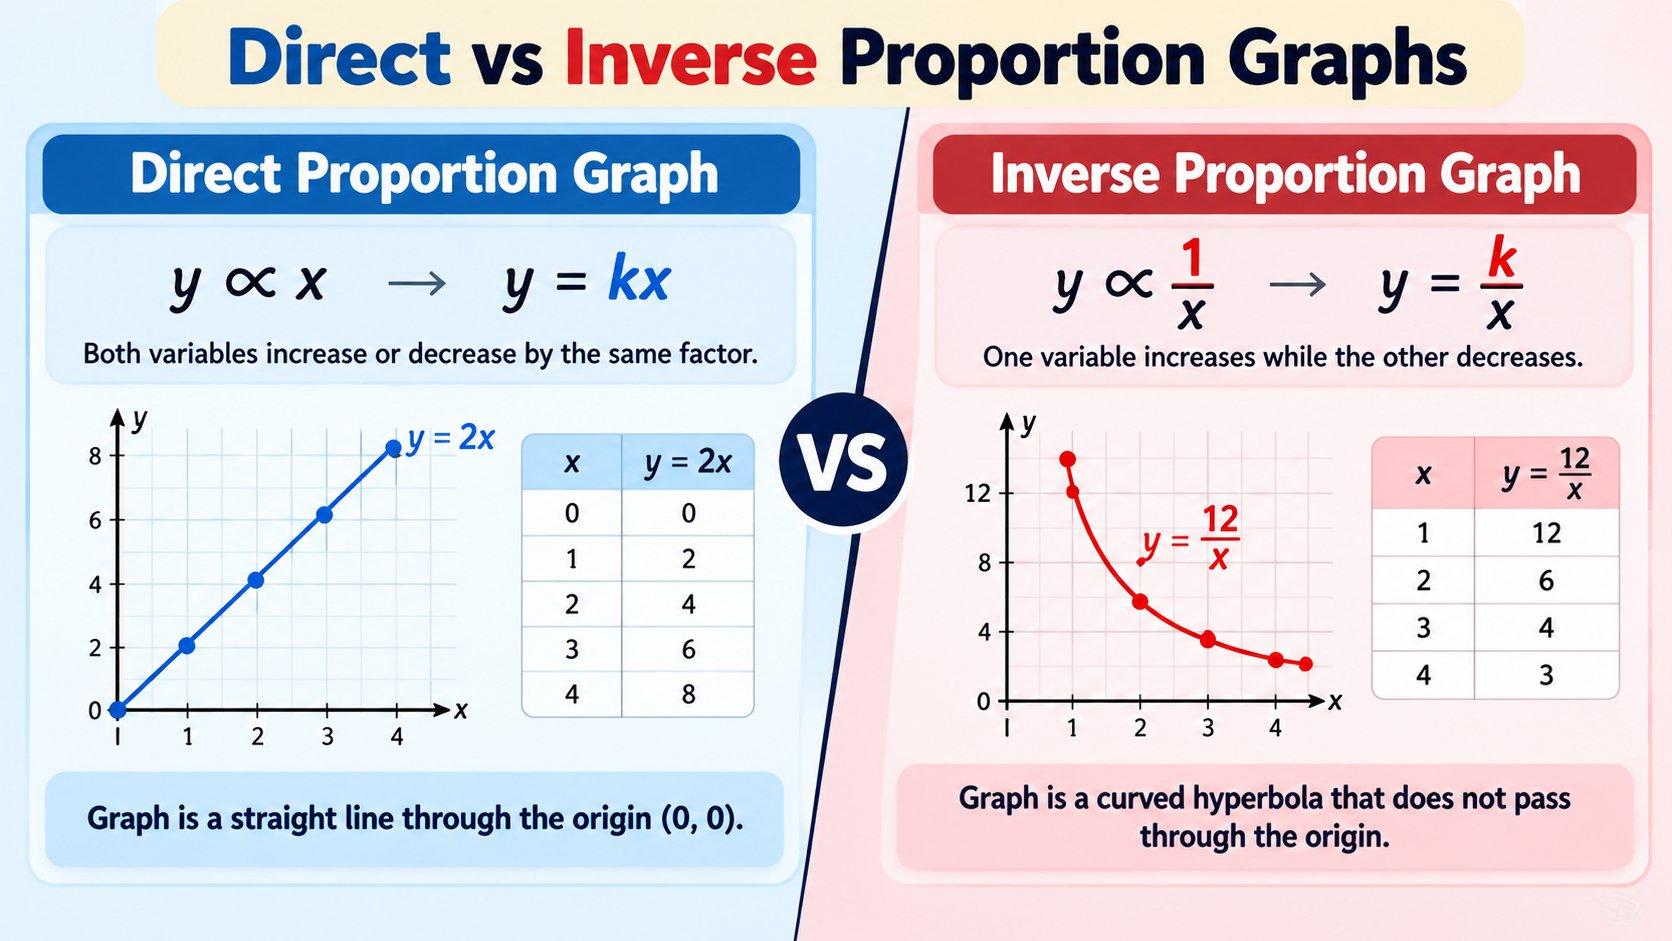
Graphs make proportional relationships much easier to understand because they allow you to see how two variables change. The direct proportion symbol, ∝, is used when one quantity changes in the same factor as another, while inverse proportion describes a relationship in which one quantity increases as the other decreases. Knowing how these relationships appear on a coordinate plane can help students identify them quickly and avoid confusing direct variation with inverse variation. The most important differences can be seen in the graph shape, equation, direction of change, and position on the coordinate plane.
What Does Direct Proportion Mean on a Graph?
A direct proportion is usually written as y ∝ x. This means that y changes in the same ratio as x. When the proportional relationship is written as an equation, it becomes y = kx, where k is the constant of proportionality.
The graph of a direct proportion is a straight line that passes through the origin. The origin is the point where the x-axis and y-axis meet, represented by (0, 0). Every point on the line follows the same proportional relationship.
For example, consider the equation y = 2x. When x is 1, y is 2. When x is 2, y is 4, and when x is 3, y is 6. Plotting these coordinate pairs produces a straight line through the origin.
The value of k controls the slope of the line. In y = 2x, the slope is 2, meaning that y increases by 2 units for every 1-unit increase in x.
What Does an Inverse Proportion Graph Show?
Inverse proportion has a very different pattern. It is commonly written as y ∝ 1/x and can be expressed as:
y = k/x
In an inverse relationship, the product of the two variables stays constant. Instead of increasing together, the variables move in opposite directions. As x becomes larger, y becomes smaller, provided that the constant and other conditions remain unchanged.
For example, take the equation y = 12/x. If x = 1, y = 12. If x = 2, y = 6. If x = 3, y = 4. As the x-value increases, the y-value decreases.
When these points are plotted, they do not form a straight line. Instead, the graph creates a curved shape known as a hyperbola.
Direct vs Inverse Proportion Graphs
The clearest way to understand the difference is to compare what happens to the variables and how the graph looks.
| Feature | Direct Proportion | Inverse Proportion |
|---|---|---|
| Relationship | y ∝ x | y ∝ 1/x |
| Equation | y = kx | y = k/x |
| Graph shape | Straight line | Curved hyperbola |
| Origin | Passes through (0, 0) | Does not pass through the origin |
| Variable movement | Increase together | One increases as the other decreases |
| Constant relationship | y/x is constant | xy is constant |
| Typical graph behavior | Constant slope | Continuously changing slope |
These differences provide a quick way to identify the type of proportional relationship shown in a graph. If the graph is a straight line through the origin, direct proportion is likely. If it is a curved graph that approaches the axes without touching them, inverse proportion is likely.
How to Recognize Direct Proportion From a Graph
Students can use several clues to identify direct variation on a graph. The first and most important clue is the origin. A direct proportion graph must pass through (0, 0), assuming the usual mathematical relationship and no restricted domain that removes the origin from the displayed portion.
The second clue is the straight-line shape. A direct proportion creates a linear graph because the equation has the form y = kx. The ratio between corresponding y and x values remains constant throughout the relationship.
The slope also gives useful information. In a direct proportion, the constant of proportionality k is the slope of the graph. For example, if the equation is y = 5x, the graph has a slope of 5.
A straight line alone, however, is not enough. An equation such as y = 5x + 3 is linear, but it is not a direct proportion because its line does not pass through the origin.
How to Recognize Inverse Proportion From a Graph
An inverse proportion graph looks completely different from a direct proportion graph. Instead of a straight line, it forms a curve. This happens because the equation contains x in the denominator, as in y = k/x.
One important feature of an inverse variation graph is that it gets closer to the axes without normally touching them. These axes act as asymptotes. The exact position of the curve depends on the sign and value of k.
When k is positive, the graph appears in the first and third quadrants. When k is negative, the graph appears in the second and fourth quadrants. This gives students another clue when interpreting an inverse relationship from a graph.
For example, y = 8/x produces a positive inverse relationship, while y = -8/x produces a negative one. Although both equations describe inverse proportionality, the graphs appear in different quadrants.
The Role of the Constant of Proportionality
The constant of proportionality helps determine the exact graph of a relationship. In direct proportion, the constant k appears as the slope of the straight line. A larger positive value of k creates a steeper line, while a smaller positive value creates a less steep line.
In inverse proportion, k controls the position and size of the curved graph. Changing k changes how far the curve sits from the origin and the coordinate axes.
This is why two direct proportion graphs can have different slopes while still following the same basic pattern. Similarly, different inverse proportion equations can produce curves with different positions while retaining the same overall hyperbolic shape.
Why Direct Proportion Passes Through the Origin
The equation y = kx explains why a direct proportion graph passes through the origin. If x = 0, then multiplying k by zero gives y = 0. Therefore, the point (0, 0) satisfies every direct proportion equation of this form.
This is an important test for students. If a line crosses the y-axis at a value other than zero, it is not a direct proportion, even if it is perfectly straight.
For example, y = 3x passes through the origin and represents direct variation. In contrast, y = 3x + 2 has a y-intercept of 2, so it is a linear relationship but not direct proportion.
Common Graphing Mistakes
- Assuming every straight-line graph shows direct proportion.
- Forgetting to check whether the graph passes through the origin.
- Confusing inverse proportion with a negative linear relationship.
- Treating the curved shape of an inverse graph as a random pattern.
- Forgetting that y/x is constant for direct proportion while xy is constant for inverse proportion.
- Plotting inverse values incorrectly because of errors in dividing k by x.
Direct Proportion Symbol and Graph Notation
The direct proportion symbol ∝ is useful because it states the relationship before the exact constant is known. For example, writing y ∝ x tells you immediately that the graph should have the form of a straight line through the origin.
The symbol can then be replaced with a constant to create the equation y = kx. This equation provides enough information to calculate coordinates and plot the graph.
By comparison, an inverse relationship can be written as y ∝ 1/x, which becomes y = k/x. The difference between x and 1/x is small in notation but produces a completely different graph.
A Simple Way to Compare the Two Graphs
A useful strategy is to ask three questions whenever you are given a graph. First, is the graph straight or curved? Second, does a straight line pass through the origin? Third, do the variables increase together or does one decrease as the other increases?
If the graph is a straight line through the origin and both variables change by the same factor, it represents direct proportion. If the graph is a curve approaching the axes and one variable decreases as the other increases, it represents inverse proportion.
This method is especially helpful in exams because it combines the visual shape of the graph with the mathematical rule behind it.
Real-World Examples of Both Relationships
Direct and inverse proportion can describe different real-life situations. Distance traveled at a constant speed is directly proportional to time because traveling for twice as long results in twice the distance. The total cost of identical products is also directly proportional to the number of products when there is no fixed additional charge.
An inverse relationship can occur when a fixed amount of work is shared among more people under ideal conditions. As the number of workers increases, the time needed may decrease. Another common example is the relationship between speed and travel time for a fixed distance, where increasing speed reduces the time required.
These examples show why understanding graph shape is more useful than memorizing a single formula. The graph gives a visual picture of how the quantities behave.
Final Comparison
Direct proportion and inverse proportion may both involve the idea of proportional change, but their graphs reveal very different mathematical relationships. Direct proportion uses y ∝ x and produces a straight line through the origin, while inverse proportion uses y ∝ 1/x and produces a curved hyperbola that approaches the coordinate axes.
The direct proportion symbol ∝ helps identify the relationship before it is converted into an equation. By learning to connect the symbol, equation, table, and graph, students can recognize proportional relationships more confidently and solve problems with fewer mistakes.

 English
 Arabic
 French
 Spanish
 Portuguese
 Deutsch
 Turkish
 Dutch
Dutch
 Italiano
 Russian
 Portuguese (Brazil)
 Greek
Greek