


How to Read an ODI Scorecard: Strike Rate, Economy and Required Run Rate
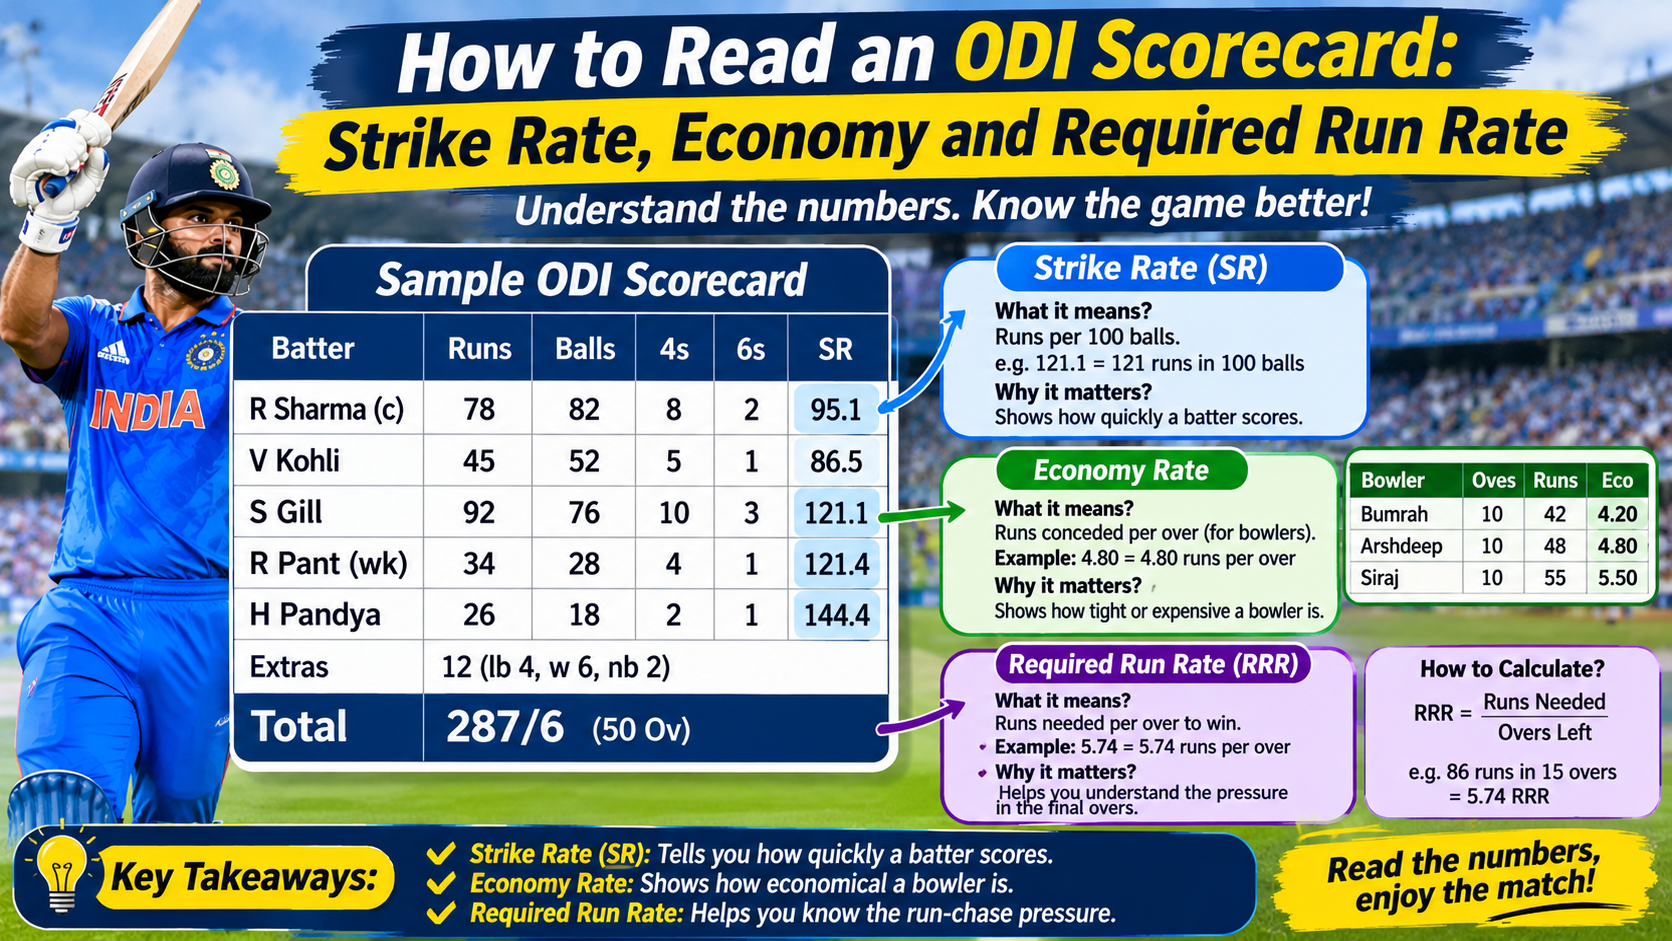
An ODI scorecard looks like a wall of numbers. Runs, balls, fours, sixes, overs, maidens, wickets, economy, strike rate, run rate, required run rate.
Once you know what each number means, the scorecard tells a story. It tells you who batted well, who bowled well, who is winning, and how many runs the chasing team needs, and how fast they need to score them.
This guide explains how to read an ODI scorecard, with the three numbers that matter most: strike rate, economy rate, and required run rate.
The scorecard, line by line
A typical ODI scorecard has two innings.
Batting:
- Runs: How many runs the batter made.
- Balls: How many balls the batter faced.
- 4s: How many fours the batter hit.
- 6s: How many sixes the batter hit.
- SR: Strike rate, runs per 100 balls.
- How out: Caught, bowled, lbw, run out, stumped, or not out.
Bowling:
- Overs: How many overs the bowler bowled. 9.0 means 9 overs, 9.1 means 9 overs and 1 ball, 9.5 means 9 overs and 5 balls.
- Maidens: How many overs where the bowler conceded 0 runs.
- Runs: How many runs the bowler conceded.
- Wickets: How many wickets the bowler took.
- Econ: Economy rate, runs per over.
- Wides / No-balls: How many wides and no-balls the bowler bowled.
Team:
- Total: Runs for wickets, for example 191 for 8, or 195 for 3.
- Overs: How many overs the team batted, for example 50 overs, or 18 overs.
- Run rate: Runs per over for the team.
- Required run rate: Runs needed per over for the chasing team.
Strike rate: how fast a batter scored
Strike rate, or SR, tells you how fast a batter scored, per 100 balls.
Formula: Strike Rate = (Runs / Balls) x 100
If a batter makes 50 runs off 50 balls, their strike rate is 100.00. They scored one run per ball.
If a batter makes 50 runs off 25 balls, their strike rate is 200.00. They scored two runs per ball.
If a batter makes 50 runs off 100 balls, their strike rate is 50.00. They scored one run every two balls.
What is a good strike rate in ODIs?
In ODIs, a strike rate of 100 is par. A batter who scores at 100 is scoring at 6 runs per over, which is the par run rate for a 300 total in 50 overs.
- Below 80: Slow, defensive batting. Useful if the team is rebuilding after early wickets, or if the pitch is difficult.
- 80 to 100: Normal ODI batting. The batter is scoring at par, rotating the strike, and building an innings.
- 100 to 120: Good ODI batting. The batter is scoring above par, with boundaries and quick running.
- Above 120: Excellent ODI batting. The batter is scoring quickly, with many boundaries.
- Above 150: Exceptional batting, usually in the last 10 overs, or by an opener in a short chase.
Strike rate matters more in the last 10 overs than in the first 10 overs. A batter who makes 30 off 40 balls in the powerplay, strike rate 75, has done a poor job, because they have wasted balls. A batter who makes 30 off 40 balls in the middle overs, strike rate 75, has done a reasonable job, if they are rebuilding after wickets.
Worked examples from this tour
Ishan Kishan, Hamilton, 1 November 2026: 61 off 32 balls, 5 fours, 5 sixes, strike rate 190.62. Calculation: 61 / 32 x 100 = 190.62. That is an excellent T20 strike rate, and it would be an excellent ODI strike rate too. Kishan scored almost two runs per ball.
Abhishek Sharma, Wellington, 27 October 2026: 113 off 38 balls, 9 fours, 11 sixes, strike rate 297.37. Calculation: 113 / 38 x 100 = 297.37. That is almost three runs per ball, the highest strike rate in a T20I hundred by an Indian. In an ODI, a strike rate of 297 would be extraordinary, and it would only happen in a very short innings.
Glenn Phillips, Auckland, 30 October 2026: 107 off 49 balls, 6 fours, 10 sixes, strike rate 218.37. Calculation: 107 / 49 x 100 = 218.37. That is a T20 strike rate, but it shows how Phillips bats in ODIs too: he scores quickly, with sixes.
Tim Seifert, Auckland, 4 November 2026, 1st ODI: 38 off 43 balls, strike rate 88.37. Calculation: 38 / 43 x 100 = 88.37. That is a normal ODI strike rate for an opener who is building an innings. Seifert was not scoring quickly, but he was not scoring slowly either. He was scoring at par for an ODI opener.
Glenn Phillips, Auckland, 4 November 2026, 1st ODI: 30 off 50 balls, strike rate 60.00. Calculation: 30 / 50 x 100 = 60.00. That is a slow ODI strike rate, and it shows that Phillips was struggling to score in the middle overs, against India's tight bowling.
Strike rate alone does not tell you if a batter did a good job. You need to look at the match situation. A strike rate of 60 is poor if the team is chasing 300 and needs 6 runs per over. A strike rate of 60 is good if the team is 50 for 4 and needs to rebuild.
Economy rate: how expensive a bowler was
Economy rate, or Econ, tells you how many runs a bowler conceded per over.
Formula: Economy = Runs / Overs
If a bowler bowls 10 overs and concedes 50 runs, their economy is 5.00. If they bowl 9 overs and concede 21 runs, their economy is 2.33. If they bowl 4 overs and concede 64 runs, their economy is 16.00.
What is a good economy in ODIs?
In ODIs, an economy of 5.00 is par, because par is 300 runs in 50 overs, or 6 runs per over for the team, but bowlers have different jobs in different phases.
- Powerplay, overs 1 to 10: An economy of 5.00 to 5.50 is good, because the batters are trying to score quickly, and the field is up.
- Middle overs, overs 11 to 40: An economy of 4.50 to 5.00 is good, because the batters are building an innings, and the bowler's job is to control the run rate.
- Death overs, overs 41 to 50: An economy of 7.00 to 8.00 is good, because the batters are trying to hit every ball for a boundary.
A bowler's overall economy is the average of their economy in each phase they bowled in. A bowler who bowls only in the middle overs will have a lower overall economy than a bowler who bowls in the death overs, even if they bowled equally well.
Worked examples from this tour
Anshul Kamboj, Auckland, 4 November 2026, 1st ODI: 2 for 21 in 9 overs, economy 2.33. Calculation: 21 / 9 = 2.33. That is an excellent ODI economy, in any phase. Kamboj bowled with control, built pressure, and took wickets, including Mitchell Santner for 4 and Nathan Smith.
Arshdeep Singh, Wellington, 27 October 2026, 3rd T20I: 1 for 33 in 4 overs, economy 8.25. That is a T20 economy, not an ODI economy, but it shows that Arshdeep was India's most economical bowler that day, even though his economy was 8.25, because T20s are higher-scoring than ODIs.
Nitish Kumar Reddy, Auckland, 30 October 2026, 4th T20I: 1 for 64 in 4 overs, economy 16.00. Calculation: 64 / 4 = 16.00. That is a very poor economy, in any format. Reddy conceded 32 runs in one over, with Phillips hitting 4, 6, 6, 6, 6.
Mitchell Santner, Christchurch, 24 October 2026, 2nd T20I: 4 for 21 in 4 overs, economy 5.25. Calculation: 21 / 4 = 5.25. That is an excellent T20 economy, and it would be an excellent ODI economy too. Santner took four wickets and conceded only 21 runs.
Economy alone does not tell you if a bowler did a good job. You need to look at the phase they bowled in, and the wickets they took. A bowler who goes for 60 runs in 10 overs in the middle overs, economy 6.00, has done a poor job. A bowler who goes for 70 runs in 10 overs in the death overs, economy 7.00, has done a good job.
Run rate and required run rate: who is winning?
Run rate and required run rate tell you who is winning in a chase, and how fast the chasing team needs to score.
Current run rate = Runs scored / Overs faced
If a team has made 150 runs in 30 overs, their current run rate is 5.00. Calculation: 150 / 30 = 5.00.
Required run rate = Runs needed / Overs remaining
If a team needs 150 runs in 20 overs, their required run rate is 7.50. Calculation: 150 / 20 = 7.50. They need to score at 7.5 runs per over for the rest of the innings.
If a team needs 100 runs in 20 overs, their required run rate is 5.00. Calculation: 100 / 20 = 5.00. They need to score at 5 runs per over.
How to use required run rate
Required run rate goes up if the chasing team scores slowly, and goes down if they score quickly. It also goes up if they lose wickets, because they have fewer batters left to score the runs.
Example: Team A make 280 for 7 in 50 overs. Team B are chasing 281 to win.
- After 10 overs, Team B are 55 for 1. They need 226 runs in 40 overs. Required run rate = 226 / 40 = 5.65. They need to score at 5.65 runs per over. That is manageable.
- After 20 overs, Team B are 110 for 2. They need 171 runs in 30 overs. Required run rate = 171 / 30 = 5.70. They need to score at 5.7 runs per over. That is still manageable, because they have 8 wickets left.
- After 30 overs, Team B are 175 for 3. They need 106 runs in 20 overs. Required run rate = 106 / 20 = 5.30. They need to score at 5.3 runs per over. That is easier, because they have wickets in hand and time.
- After 40 overs, Team B are 245 for 4. They need 36 runs in 10 overs. Required run rate = 36 / 10 = 3.60. They need to score at 3.6 runs per over. That is easy, unless they lose wickets.
Now the same example, but Team B lose wickets:
- After 30 overs, Team B are 175 for 6. They need 106 runs in 20 overs. Required run rate is still 5.30, but they have only 4 wickets left. They need to score at 5.3 runs per over, with only 4 wickets left, which is much harder.
Required run rate does not tell you about wickets. You need to look at both the required run rate and the wickets left. A required run rate of 5.30 with 7 wickets left is easy. A required run rate of 5.30 with 4 wickets left is hard.
Worked example from Auckland, 4 November
In the 1st ODI in Auckland on 4 November, New Zealand were 146 for 9 after 35.1 overs, after India won the toss and chose to bowl. Their current run rate was 146 / 35.166 = 4.15 runs per over. That is a low run rate for an ODI, and it shows that India's bowlers controlled the middle overs.
If New Zealand had made 200 in 50 overs, India would need 201 to win. If India were 100 for 1 after 20 overs, chasing 201, they would need 101 runs in 30 overs, required run rate 3.37. That would be an easy chase.
If New Zealand had made 280 in 50 overs, India would need 281 to win. If India were 100 for 1 after 20 overs, chasing 281, they would need 181 runs in 30 overs, required run rate 6.03. That would be a harder chase.
The scorecard tells you the target, the current run rate, and the required run rate. It does not tell you the final result, until the match is over.
How to read a scorecard in 30 seconds
Here is a quick way to read an ODI scorecard:
- Look at the total and overs. Did the team batting first make 300 in 50 overs, or 200 in 50 overs? 300 is par on a good pitch. 200 is below par.
- Look at the top three batters. Did one batter make a hundred, or did three batters make fifties? A hundred is a match-winning innings. Three fifties is a team innings.
- Look at the strike rates. Did the top-order batters score at 100 or above? If they scored at 80 or below, they were slow.
- Look at the bowling figures. Did one bowler take 4 wickets, or did five bowlers take one wicket each? Four wickets is a match-winning spell. One wicket each is a team bowling performance.
- Look at the economy rates. Did the bowlers go for 4.50 in the middle overs, or 6.00? 4.50 is good. 6.00 is poor.
- If it is a chase, look at the required run rate and wickets left. A required run rate of 5.00 with 7 wickets left is easy. A required run rate of 5.00 with 4 wickets left is hard.
What the numbers do not tell you
The scorecard does not tell you everything. It does not tell you:
- How the pitch played. A total of 250 on a green pitch at Wellington could be a winning score. A total of 250 on a flat pitch at Bay Oval could be a losing score.
- How the weather affected the match. A match that was shortened by rain will have a DLS target, not a normal target.
- How the fielding was. A team that dropped three catches will have a worse bowling figure than a team that took all their catches.
- How the captain used their bowlers. A bowler who bowled in the powerplay and the death will have a higher economy than a bowler who bowled only in the middle overs, even if they bowled equally well.
That is why you need to watch the match, not just read the scorecard. The scorecard is a summary, not the whole story.
For fans following the series, the scorecard is the fastest way to check who is winning. Cricbet99 is a gaming and betting-related platform, not an official broadcaster, and any betting-related features are for adults only, where legally permitted. Use responsibly and check local rules, as betting law in India varies by state. For live scores, the official broadcast remains Sony Sports Network and Sony LIV in India.
FAQs
What is strike rate in ODI cricket?
Runs per 100 balls, calculated as (Runs / Balls) x 100. A strike rate of 100 means one run per ball. A strike rate of 150 means 1.5 runs per ball.
What is economy rate in ODI cricket?
Runs conceded per over, calculated as Runs / Overs. An economy of 5.00 means 5 runs per over. An economy below 5.00 in the middle overs is good.
What is required run rate in ODI cricket?
Runs needed divided by overs remaining, for the chasing team. If a team needs 150 runs in 20 overs, their required run rate is 7.50.
What is a good strike rate in ODIs?
100 is par. 80 to 100 is normal. 100 to 120 is good. Above 120 is excellent. Above 150 is exceptional, usually in the last 10 overs.
What is a good economy in ODIs?
4.50 to 5.00 in the middle overs is good. 5.00 to 5.50 in the powerplay is good. 7.00 to 8.00 in the death overs is good.
How do you calculate required run rate?
Runs needed / Overs remaining. If you need 100 runs in 25 overs, your required run rate is 4.00.
Verdict
To read an ODI scorecard, learn three formulas:
- Strike rate = (Runs / Balls) x 100. It tells you how fast a batter scored.
- Economy = Runs / Overs. It tells you how expensive a bowler was per over.
- Required run rate = Runs needed / Overs remaining. It tells you how fast the chasing team needs to score.
Use those three numbers, plus the wickets left, plus the match situation, and you can read a scorecard in 30 seconds.
A strike rate of 190, like Kishan's 61 off 32 in Hamilton, tells you the batter scored quickly. An economy of 2.33, like Kamboj's 2 for 21 in 9 overs in Auckland, tells you the bowler was excellent. A required run rate of 5.30 with 7 wickets left tells you the chase is easy. A required run rate of 5.30 with 4 wickets left tells you the chase is hard.
The numbers are simple. The story they tell is not.

 English
 Arabic
 French
 Spanish
 Portuguese
 Deutsch
 Turkish
 Dutch
 Italiano
 Russian
 Romaian
 Portuguese (Brazil)