


How to Read Cricket Match Statistics on 11xPlay
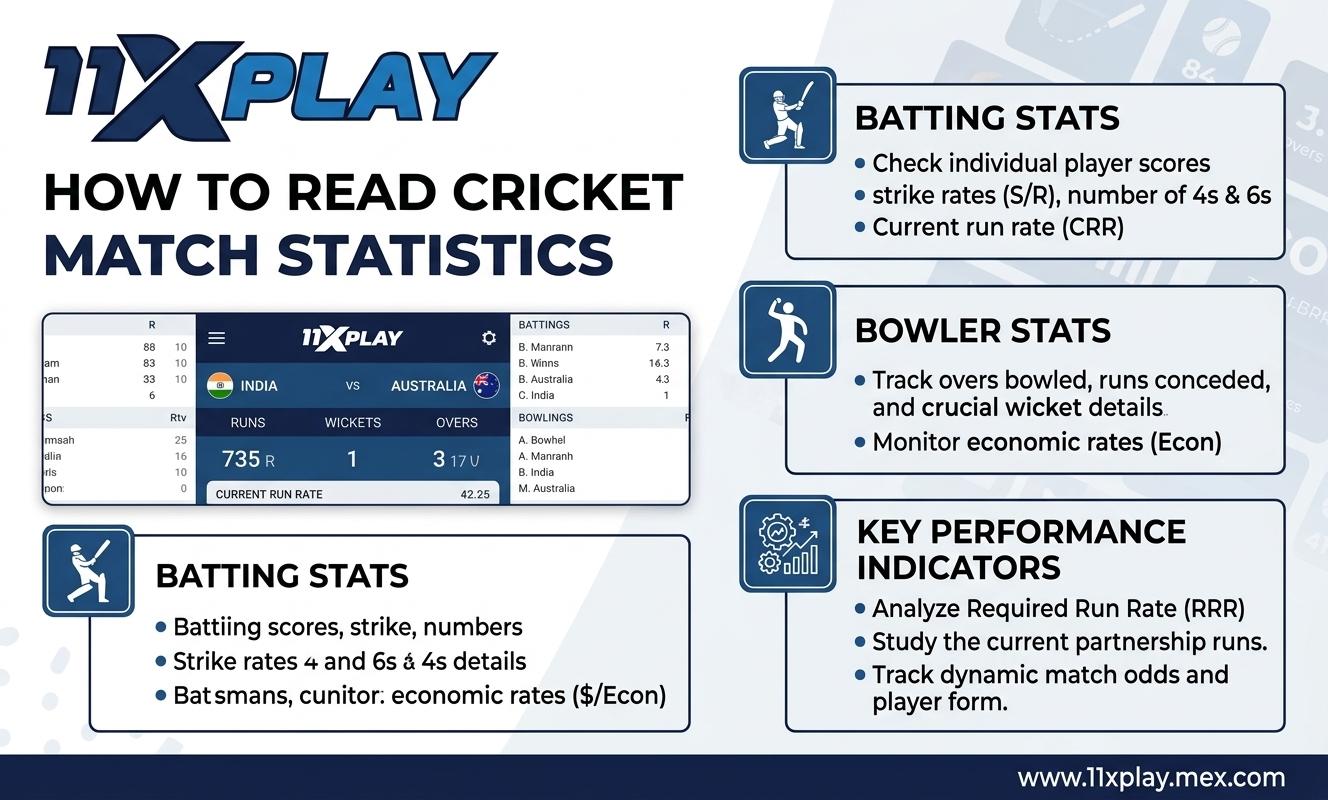
Cricket statistics help readers understand what is happening in a match beyond the final score. On 11xplay, knowing how to interpret batting figures, bowling records, partnerships, and team totals can make match information easier to follow. Rather than focusing on individual numbers, readers should consider the match situation, playing conditions, and performance trends together to develop a clearer understanding of the game.
Why Are Cricket Match Statistics Important?
Statistics provide a factual overview of individual and team performance. They show how quickly a team scores, how effectively bowlers restrict runs, and how partnerships influence an innings. However, a single number rarely explains the complete story.
For example, a team scoring 160 runs might have performed well on a difficult pitch but struggled on a surface that favours batting. Similarly, a bowler conceding 35 runs could have bowled effectively if they also took important wickets.
Therefore, always consider the match format, conditions, overs completed, wickets lost, and opposition strength before drawing conclusions.
How to Read a Cricket Scorecard
A scorecard summarises the most important details of an innings. Understanding its main sections makes it easier to follow match progress.
Key batting statistics include:
-
Runs: The total number of runs scored by a batter.
-
Balls faced: The number of deliveries faced, excluding certain deliveries such as wides.
-
Fours and sixes: Boundaries scored along the ground and over the boundary, respectively.
-
Strike rate: Runs scored per 100 balls faced. A higher figure generally indicates faster scoring.
For example, a batter scoring 45 runs from 30 balls has a strike rate of 150. This means the batter scored at a rate equivalent to 150 runs per 100 balls.
The bowling section usually displays overs, maidens, runs conceded, wickets taken, and economy rate. Together, these figures show how a bowler performed during an innings.
What Do Batting and Bowling Figures Tell You?
Batting and bowling statistics provide different perspectives on the same match. Consequently, comparing them gives a more balanced picture.
A batter's average indicates consistency across dismissals, while the strike rate highlights scoring speed. In limited-overs cricket, both figures matter because players must balance run accumulation with the required scoring rate.
Bowling statistics also need context. The economy rate measures the average runs conceded per over. For instance, an economy rate of six means a bowler conceded an average of six runs per over.
However, economy alone does not establish a bowler's effectiveness. Wickets, the quality of the batters faced, and the match situation also matter. A bowler might concede more runs while taking crucial wickets, whereas another might maintain a low economy without creating many dismissal opportunities.
How to Understand Partnerships and Run Rates
Partnerships show how many runs two batters add together before one of them is dismissed or the innings ends. A strong partnership can stabilise an innings after early wickets or accelerate scoring towards the end.
Run rate is another useful measure. It represents the average runs scored per over.
For example, a team scoring 90 runs in 10 overs has a run rate of nine runs per over. In a limited-overs chase, compare this figure with the required run rate to understand the scoring demand.
The required run rate indicates how many runs per over a chasing team needs to reach its target within the remaining overs. Nevertheless, wickets in hand and the available batters can significantly influence whether that target is achievable.
How to Compare Match Statistics Accurately
When reviewing figures through the 11xplay platform, compare statistics within the same context rather than treating every record as directly equivalent.
Consider these factors:
-
Match format: Test cricket, ODIs, and T20s require different approaches to scoring and bowling.
-
Recent performance: Recent figures can provide context, but a short run of matches does not guarantee future results.
-
Head-to-head records: Previous meetings offer historical context, although team composition and conditions may have changed.
-
Pitch and weather: Surface conditions and interruptions can affect scoring patterns.
-
Match situation: The same score can have different significance depending on wickets, overs remaining, and the target.
If you are unfamiliar with the platform's account features, read this registration guide for information about registration and account access.
Where Can You Find and Review Match Information?
Depending on the features available, a scorecard or match information page may display live scores, completed innings, player figures, and other match details. Check the timestamp and source to confirm that the information is current.
If you use login to access an account, make sure you are on the correct website and follow its published security guidance. An 11xplay ID may be relevant to account access, but it does not determine the accuracy of cricket statistics.
Likewise, check the information available through the app against a reliable cricket scorecard when possible. If you need to 11xplay register, review the applicable requirements and privacy information before submitting personal details.
Conclusion
Understanding cricket statistics becomes easier when you examine individual figures alongside the broader match situation. From batting strike rates to bowling economy and required run rates, each measure offers a different piece of information. By comparing relevant figures carefully and checking reliable sources, readers can follow match developments more confidently without relying on isolated numbers or assumptions.

 English
 Arabic
 French
 Spanish
 Portuguese
 Deutsch
 Turkish
 Italiano
 Russian
 Romaian
 Portuguese (Brazil)
 Greek
Greek